Calculating the future of the Indian River
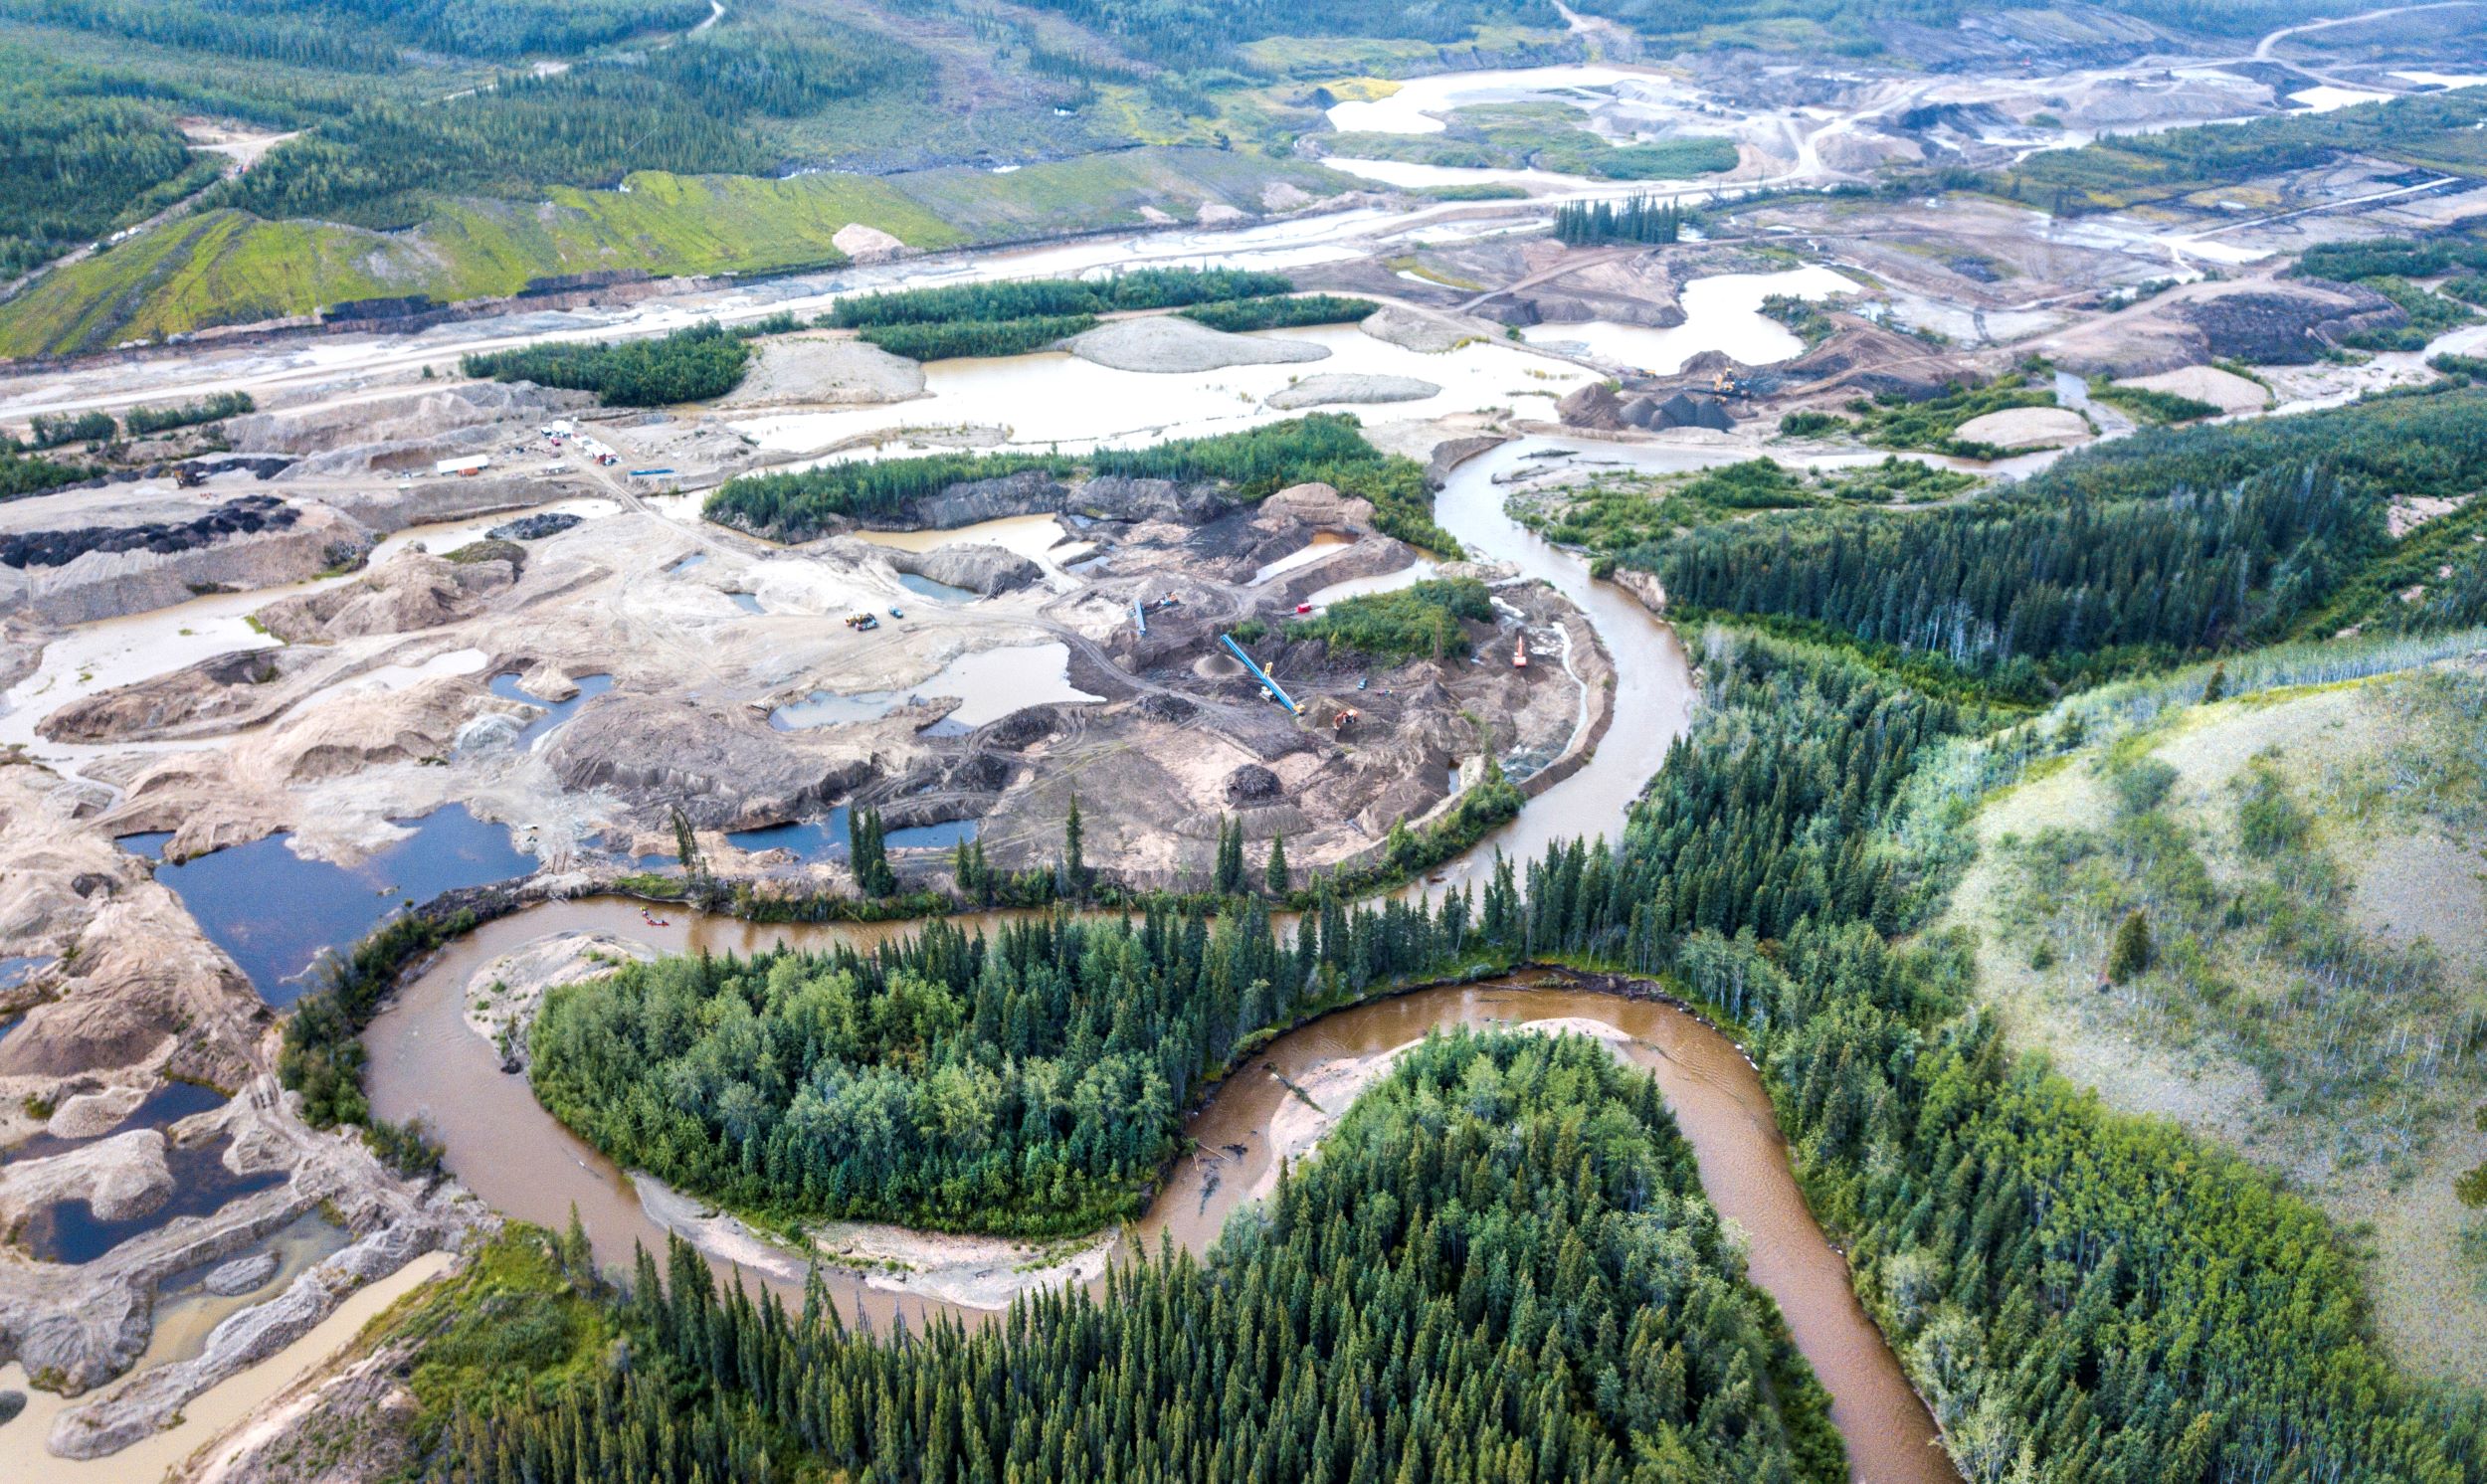
Header Image: Indian River near Sulphur Creek, by Malkolm Boothroyd
Written by Malkolm Boothroyd, Campaigns Coordinator
What does the future of the Indian River look like?
That question was at the front of my mind as I read the draft land use plan for the Dawson Region. One number jumped out—5%. That’s the amount of disturbance the land use plan would permit in the landscape management unit that encompasses the Indian River, and the rest of the goldfields. 5% may not sound like much disturbance, but when you look closely it’s shocking.
I explored some of the implications of this number in this story map. I decided to go into more depth in this blog because a) it’s a topic that fascinates me, and b) it’s good practice to be transparent about the math and the assumptions that go into making conclusions like the ones I made in this story map.
I’ve been drawn to the Indian River ever since I canoed it last summer. It’s a river that few people ever paddle, and it’s clear why. In places the river is so coiled that you have to paddle three kilometres of river to make it six hundred metres as the raven flies. Some parts are choked with fallen trees, and we lost count of the number of portages we made. Sections of the river are engulfed by placer mining, and the noise of machinery drowns out the sound of the river. Still, there are places where the river carries you far away from the mines. Then you’re surrounded by ancient trees, and you drift by river banks that are crisscrossed in moose tracks.
The Indian River wetlands have long been a breadbasket to the Trʼondëk Hwëchʼin, but many citizens have expressed that they no longer feel comfortable hunting and fishing in these areas. Sorting out the future of conservation and development in the Indian River was one of the big challenges facing the Dawson Land Use Planning Commission, and it’s one part of the plan that needs some big improvements.
Okay, time for some math.
The first question I wanted to answer was how much new development the land use plan would permit. The Indian River is part of Landscape Management Unit (LMU) 12 – East – Nächo dëk. This is designated as an Integrated Stewardship Area IV, the designation that permits the greatest possible amount of development. Surface disturbances (such as areas covered by mines, gravel pits, work camps, roads and farmland) are allowed to cover 5% of the landscape. Linear disturbances (like roads, trails and cut lines) can cover 5 kilometers per km2. LMU 12 is 6,606 km2 in total, so that means there could be up to 330.3 km2 of surface disturbances, and 33,030 kilometers of linear disturbances.
I started by looking at the existing disturbance maps for LMU 12. These maps are around ten years old (new maps are expected next spring), but they’re still helpful. The disturbance maps show there are already 113 km2 of surface disturbances and 3,552 kilometers of linear disturbances.
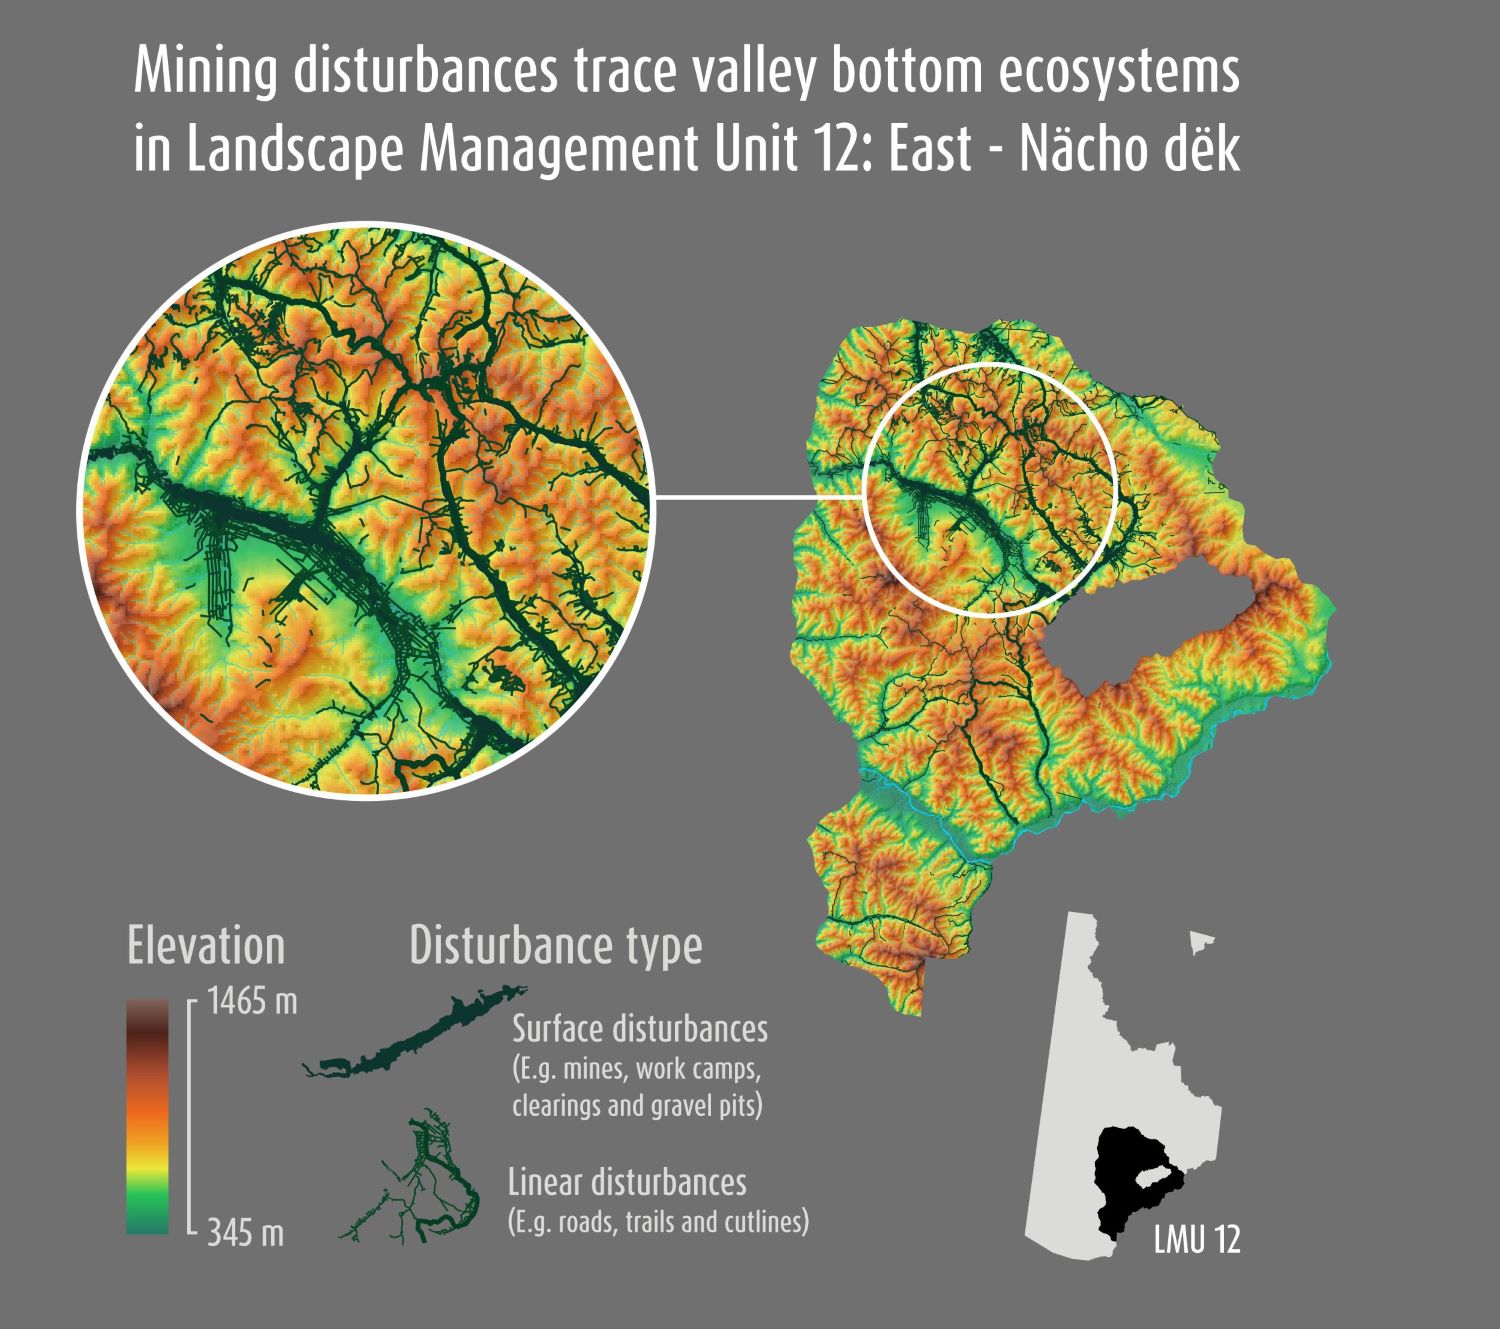
For the purposes of my analysis for the story map I created one single disturbance polygon by combining the surface and linear disturbance layers. I transformed the linear features into polygons by applying a 10 metre buffer around roads, and a 5 metre buffer around all other features. These numbers are a rough estimate, though I measured the width of the Hunker Creek Road using Google Earth, and it seems like the right ballpark. This new disturbance layer was 152 km2 in size.
There’s one big catch in the land use plan’s 5% disturbance limit. It’s calculated by averaging out disturbances across the entire landscape management unit, but in reality disturbances are not uniformly distributed. Almost all the development within this area is associated with placer mining, which closely traces the bottoms of valleys—which also happen to be some of the most fragile and biodiverse environments within the landscape. The way the land use plan is written, a whole lot of development could be packed into valley bottoms, while still keeping within the 5% limit.
I was curious to know exactly how much development occurs within the bottoms of valleys. For the purposes of this analysis I defined a ‘valley’ as an area within 500 metres of a river, or 250 metres from a stream. I excluded areas higher than 700 metres. These valleys make up 1,656 km2. That’s 25% of LMU 12, but 76% of disturbances fell within these valleys. Put another way: my combined disturbance polygon averaged out to 2.3% disturbance across all LMU 12, but reached 7% disturbance within valley bottoms.
Next, I extrapolated this to a scenario where disturbances consume 5% of LMU 12. If new developments follow the same patterns as prior disturbances, then disturbance levels within valley bottoms could reach 14.8%.
This is already a tremendous amount of disturbance within valley ecosystems, but it doesn’t give the full picture. This assumes that development would be spread evenly throughout the valleys of LMU 12, but in reality disturbances are concentrated within the Indian River watershed. I wanted a picture of what development around the Indian River could look like.
To do this, I first worked out how much new development could be added to LMU 12. If there’s currently 152 km2 of disturbances at last count, then there’s room for an additional 178 km2 of disturbances within the 5% disturbance limit. Some of this would be accounted for by the footprints of linear disturbances, so I applied the ratio of surface: linear disturbances (113:39) within my combined disturbance polygon and estimated from 178 km2 of disturbances, 131 km2 could be new mining disturbances. That would bring the total mining-related disturbances within LMU 12 to 245 km2, plus 85 km2 of roads, trails, cut lines and so forth.
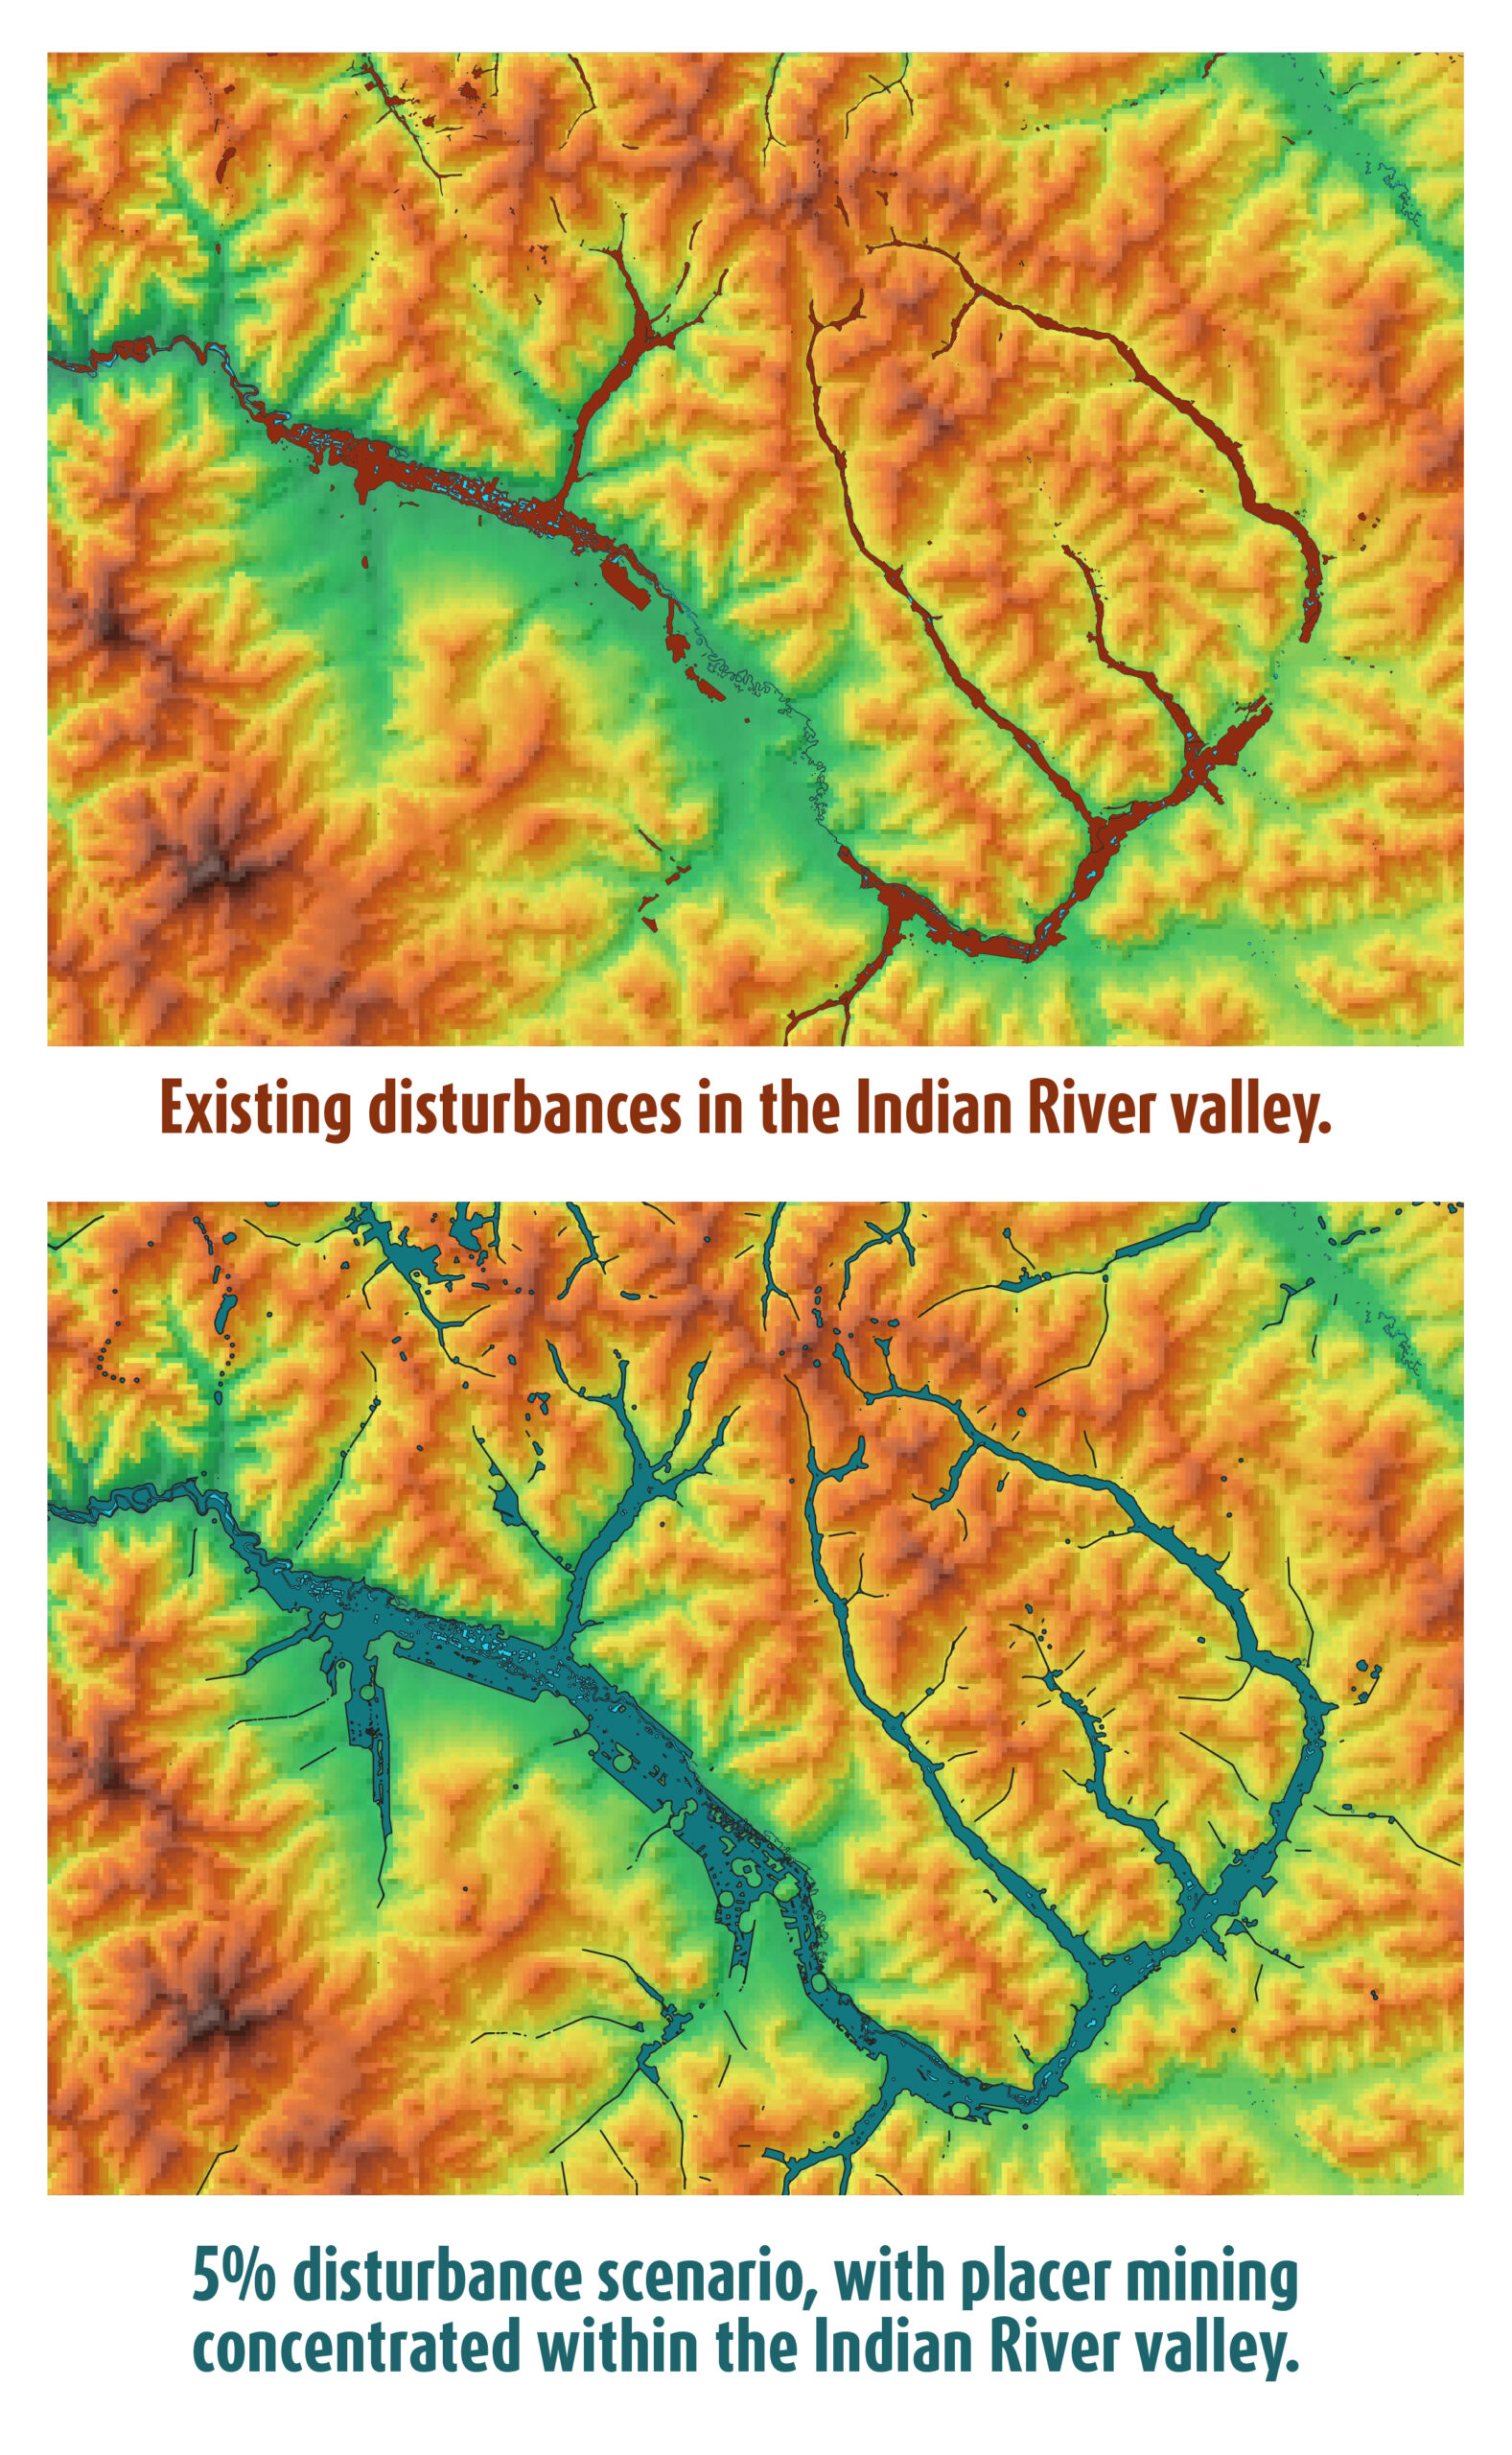
Finally, I used QGIS to create a 245 km2 large polygon layer. I did this by expanding existing disturbances, and creating new disturbances in QGIS from lands staked for placer mining. Finally, I removed rivers and “undisturbed” wetlands from the land available for disturbance. The land use plan states that there shouldn’t be new mining in undisturbed wetlands, but what an “undisturbed” wetland is, isn’t clearly defined. For the purposes of this map, I decided to define “undisturbed” wetlands as wetland areas 100 metres or more from existing disturbances. In reality this will be a much more complicated process, which I’ll leave up to hydrologists and land use planners.
So here are the maps.
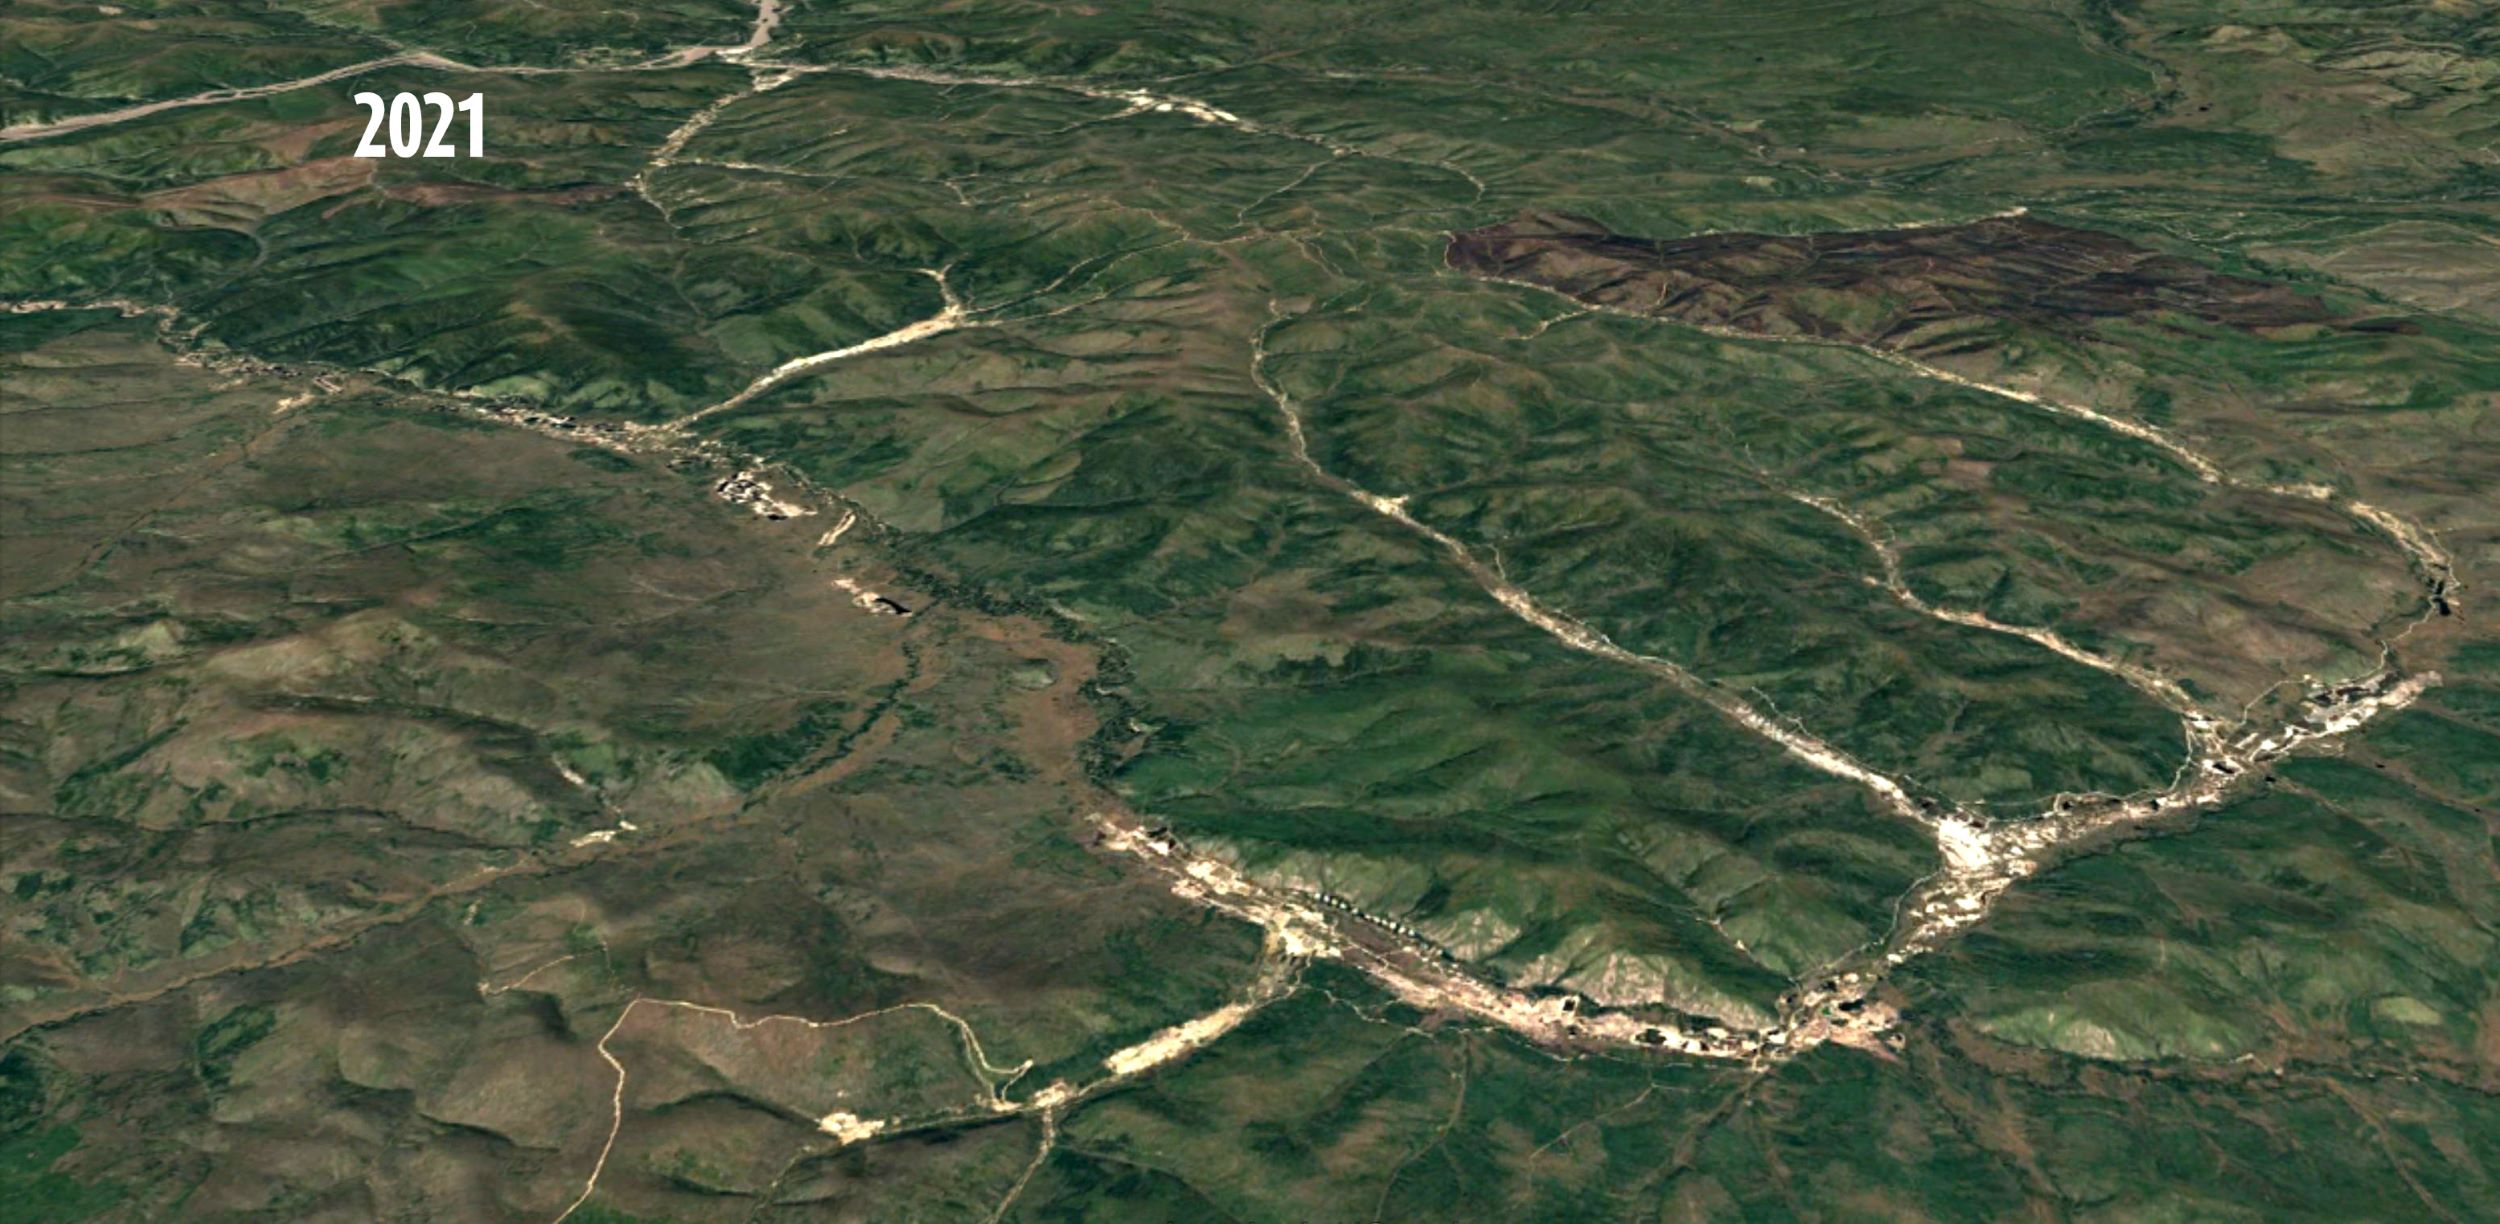
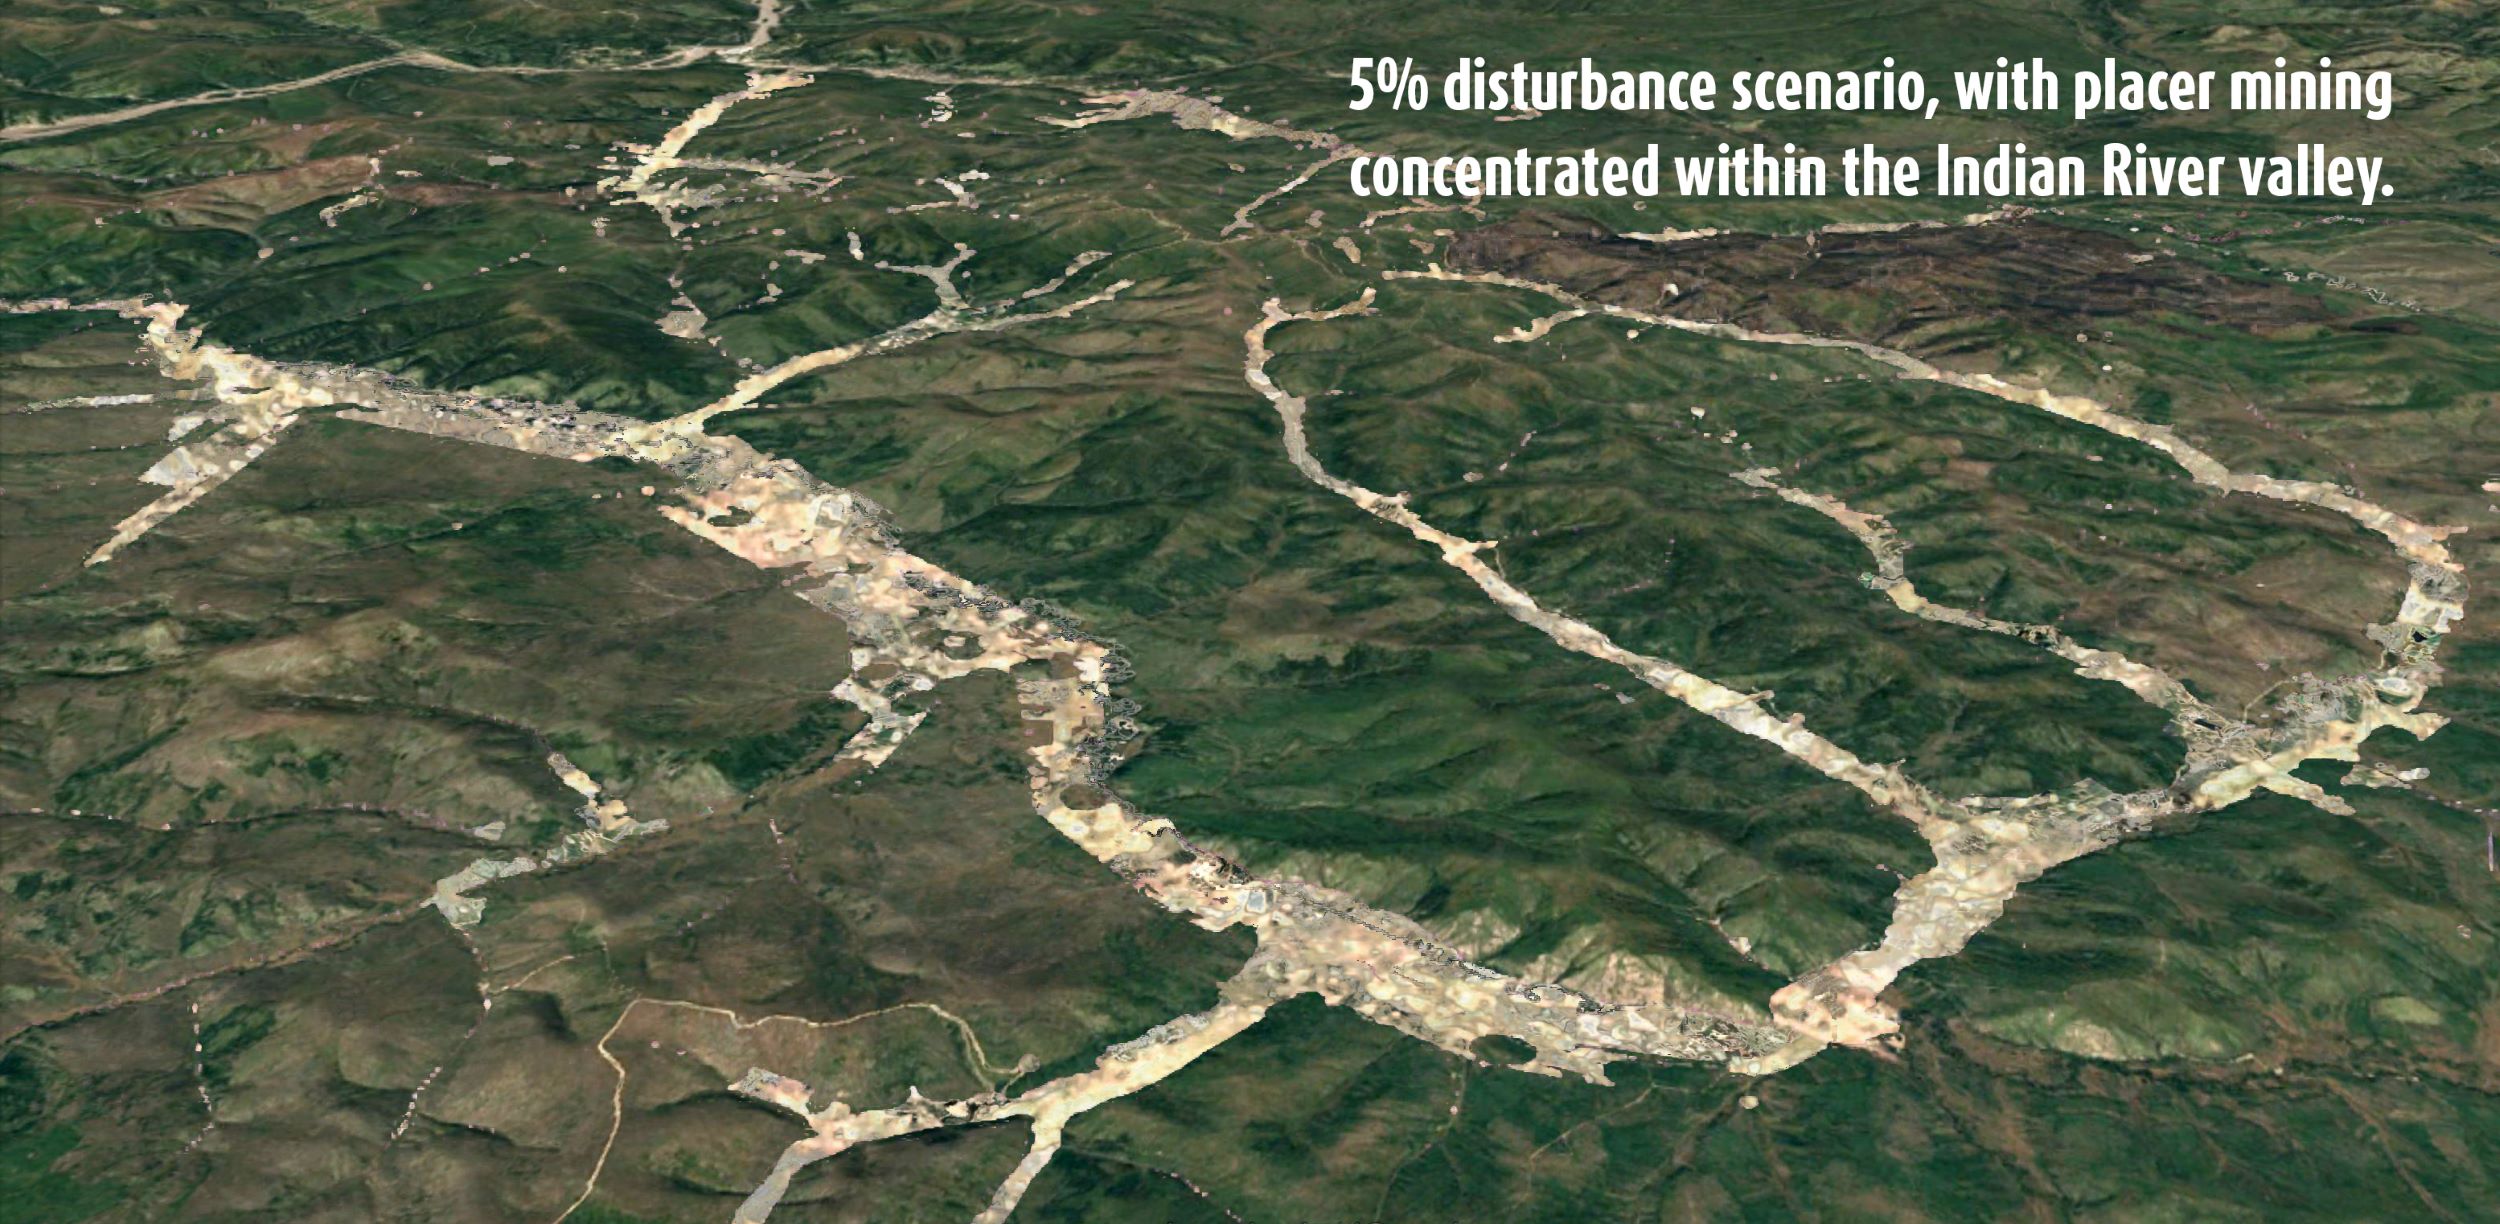
It’s important to note that these maps are just a scenario, and there’s no guarantee that these specific places would be mined. Rather, these maps show that the draft plan would allow for tremendous amounts of new development—and these disturbance limits aren’t very limiting.
There’s already been a lot of mining along the Indian River, but that doesn’t mean we should write the valley off as a wasteland. There’s a lot that’s worth conserving. I hope the Dawson Land Use Planning Commission will make some big changes to the land use plan so that the Indian River gets the protection it deserves.
